emoto captured and visualised the global response around the London 2012 Olympic Games on Twitter in an interactive online visualisation and physical data sculpture
emoto captured and visualised the global response around the London 2012 Olympic Games on Twitter in an interactive online visualisation and physical data sculpture
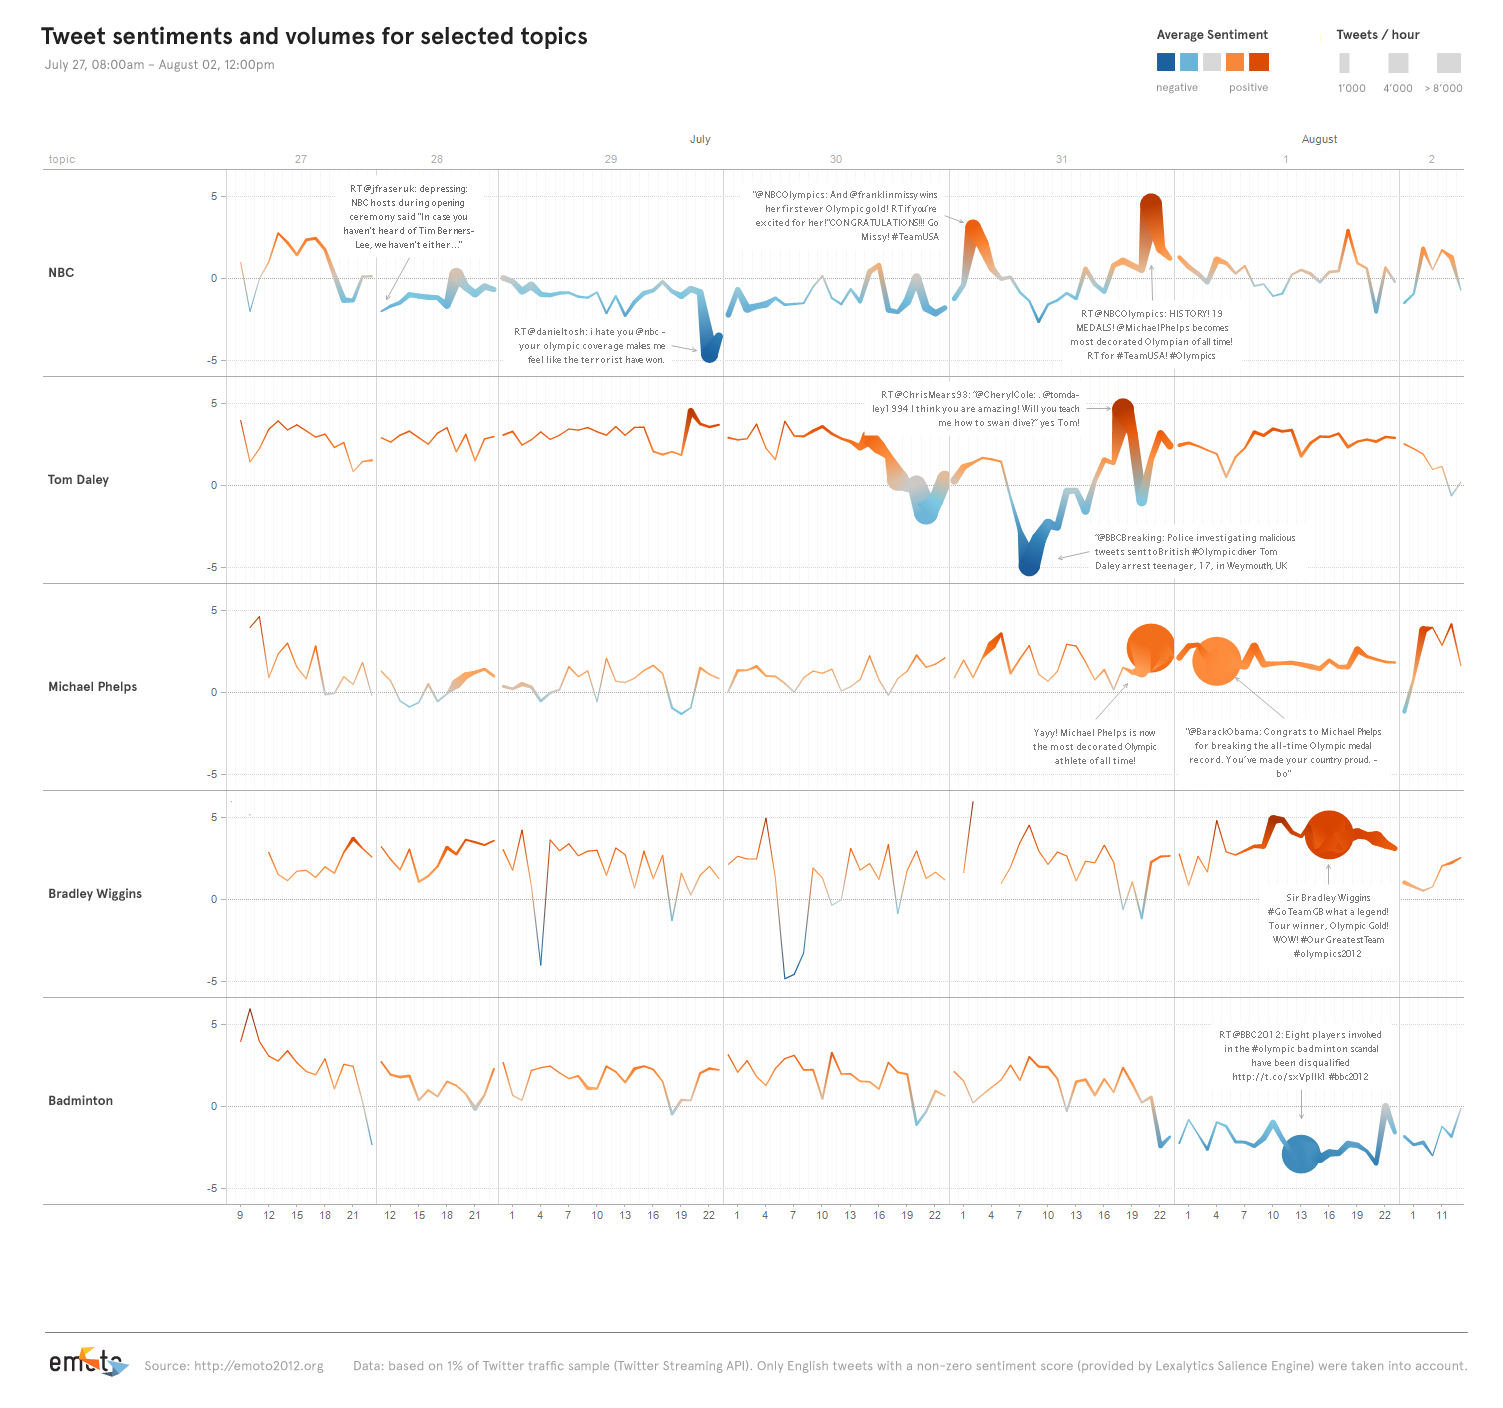
In the online visualisation, we have created two different perspectives onto the data. Using a combination of two interactive views, users were able to explore the ebbs and flows of discussions online. The Topics View, focused on communicating how much positive or negative attention each event, athlete or social topic was generating at each moment and over time. The anecdotal and ephemeral was seen in the Message Stream View which showed Tweets in real-time as they were posted around the world.
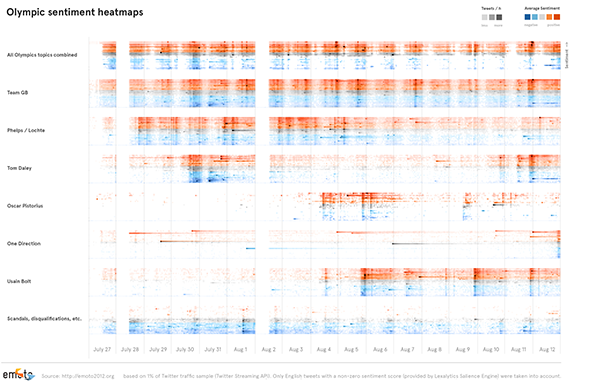
The core of the installation is a physical data sculpture consisting of 17 objects, each representing all Tweets we have collected during one day of the Olympics. Mapped onto this physical sculpture we have then projected individual heat maps for the most interesting themes we have identified while observing emoto during the Games. Users were able to navigate through these themes using an interactive controller and thus explore our archive. The second key element in the installation was the 9.50 meter long Sentigraph representing giving a high-level overview over London2012 as seen by emoto.
In addition, we continuously analyzed the data gathered (12 million English tweets with sentiment values) and documented our findings on the emoto blog.

This research report (pdf) charts the development and release of the emoto project, and positions it in relation to current debates on data and visualisation.
Published in the proceedings of ISEA2013, Sydney.
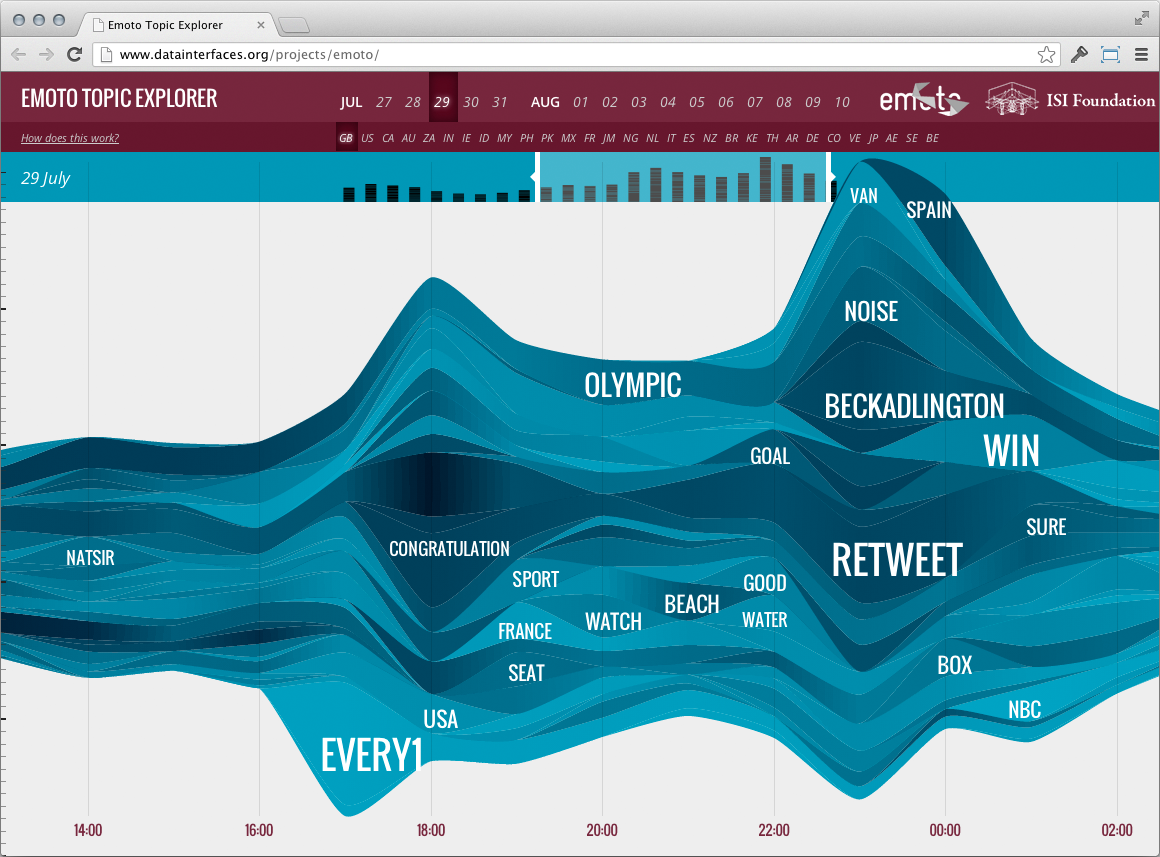
We also supplied the collected data to the Data Science Laboratory of the ISI Foundation. As a result of the collaboraton, the EMOTO Topic Explorer is an exploratory tool designed to expose the topical and temporal dimensions of Twitter conversations. Grouping thousand of tweets into thematic clusters, the interface provides an overview of online discussions and of collective attention flow over time. Try out the online version to see what topics were discussed on Twitter during the Olympics, zoom in on the salient moments, and understand how the contributions and interest differ across the nationalities.
For any further questions, please contact the team at info@emoto2012.org